Turns out, the key to the Fib Retracement indicator is to turn off the garish horrible colours and, more importantly: set it to be log-scale if you habitually use a log-scale graph.
When you turn on that button it all starts to make sense.
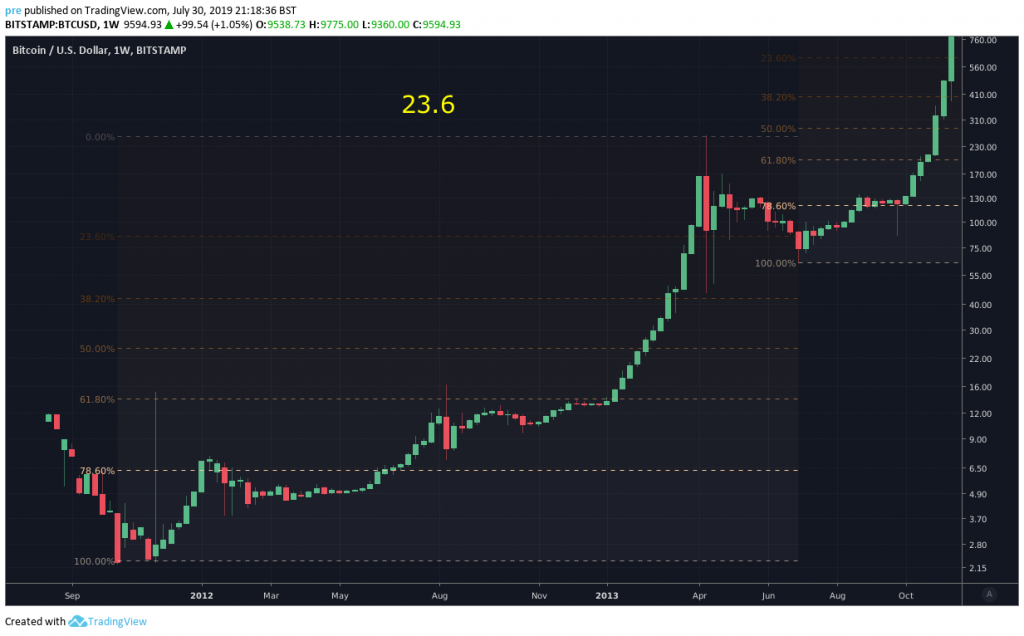
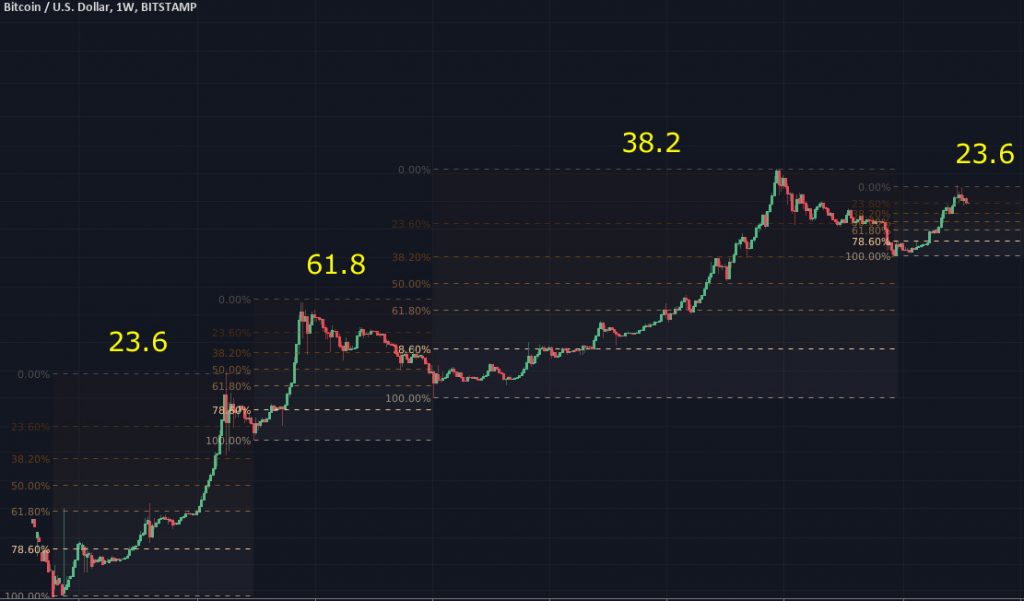
After the 2012/2013 rise in price, the price rapidly spiked down to the 38.2% level, but mostly ranged above the 23.6%, finally spiking down for less than a week and rising again. That spike down below the 23.6% ought to show as a wick on the weekly candles here really, except for the unusual chance of it occurring during during weekend.
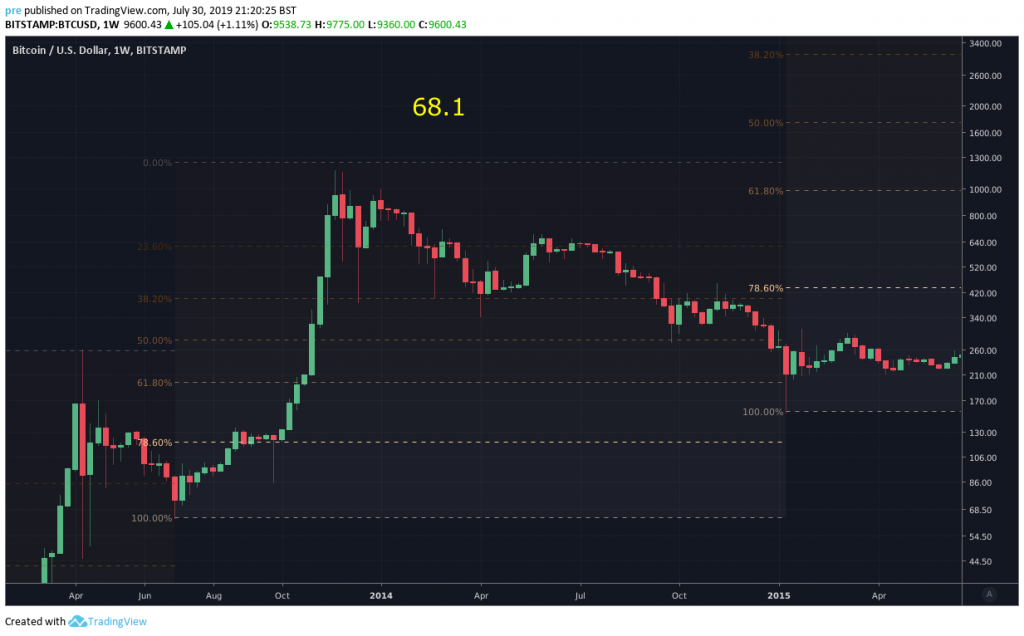
The following bull trend lasted till November 2013, and the retracement was a long one: The bear market of 2014. The price spiked down to the 38.2% level, hovered above the 23.6% level for a while then dropped further to the 38.2% level proper. It staggered on there for a while, then jumped back up a level, before this time falling more catastrophically down to the 50% level, and then bottomed at the 61.8% level to begin the next bull rise.
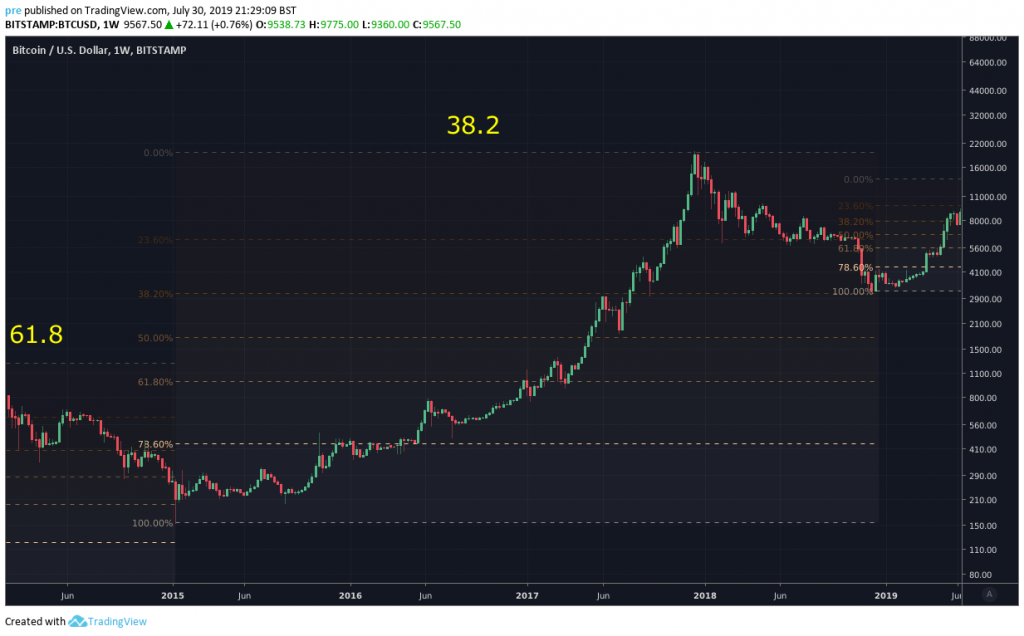
The next rise was the epic bull market which took the price from a hundred and fifty dollars up to twenty thousand dollars over 2015, 2016 and up until xmas 2017.
The retracement did a massive descending triangle, bouncing down onto the 23.6% level like six times, then dribbled off the bottom of it to bounce immediately from the 38.2% level when it started it’s next bull run.
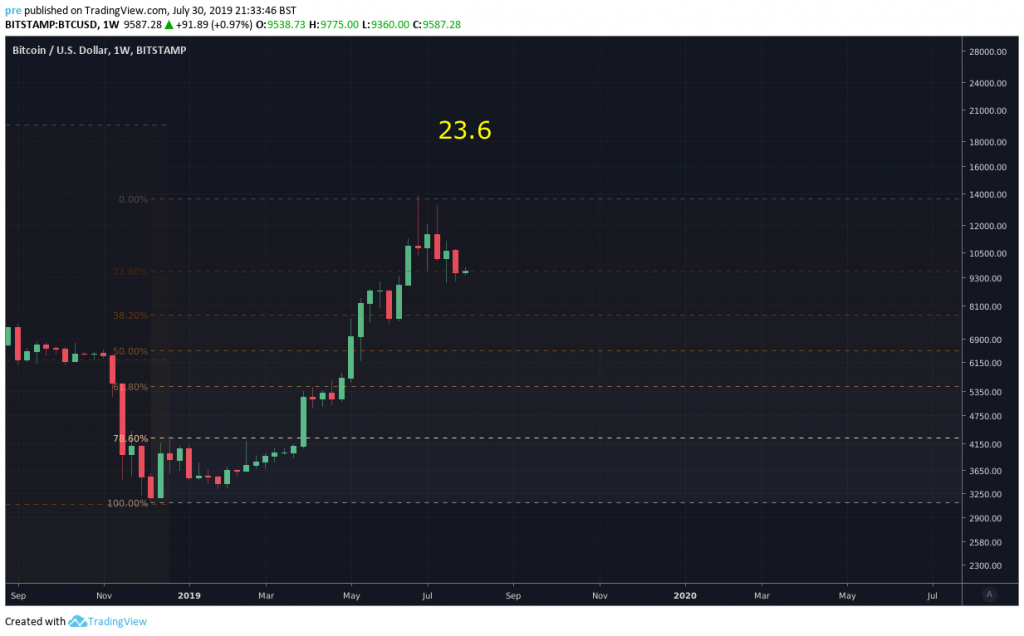
The the first six months saw the price rise again with hardly any pullback until it peaked at 13,800 dollars. Is that the end of the bull run? If so how big will the retracement be?
The price is currently hovering at about the 23.6% level, which has marked the bottom of a retracement before.
If it goes much lower though, the next couple of likely places to bounce back are presumably the 38.2% level (7700 dollars), or the 50% level (6500 dollars), or the 61.8% level (5500 dollars)
I mean I’m not an expert trained Technical Analyis professional or anything, but that’s just how the tool seems to map if you drag it from the low to the high of the price-rises then extend it to the right to try and guess the bottom.
Suppose that’s what it’s for, right?
Never seemed to fit on my graphs when I tried it until I found that log-scale setting in the indicator’s chart.
Why are those seven price-levels in particular highlighted out of all 100 of the possible percents? They come out of the Fibonacci sequence of adding one number to it’s previous two. They pick of numbers in the sequence to divide.
Why would price graphs tend to retrace to those levels?
My guess would be that feedback games like price-markets are complicated, but can be simplified if all the traders are using the same arbitary rule-books and patterns. Even if sometimes subconsciously. Some rules can become self-reinforcing situations like markets I think.
If all the traders are looking at those levels in particular to set their buy-orders, that’s where the bulk of the buys go.
What are the odds are of the retracements fitting the rises so well if they were just random walks rather than market-prices? Perhaps you can lay that tool over any random walk in a million different ways retrospectively and I just picked that one.
And of course this bull run might not be over. It’s possible in order for it to count as a bull run it should have gone above the prior high really anyway. I’d almost definitely want to retrospectively redraw the chart that way if it just went up above 20k this year.
I shall be watching my new Fib-Chart for a while at least anyway.